UBC B.A. GRADUATE IN ECONOMICS
UBC LIFE BLOG SOCIAL ANALYTICS
PROJECT DETAILS
ROLE:
LEAD DATA ANALYST
RESPONSIBILITIES:
-
Collected and reported bi-weekly analytics over an 8-month period, utilizing Google Analytics and Hootsuite to monitor KPIs for UBCLife Blog and twitter.
-
Analyzed KPIs to target high performing posts, documenting them to be resurfaced annually
-
Presented and reported analysis to Creative and Editorial Team as well as directors of UBC Student Communications Services with recommendations for revamping the marketing communication strategy.
TOOLS:
GOOGLE ANALYTICS, HOOTSUITE, GOOGLE SEARCH CONSOLE, CONFLUENCE
DELIVERABLES:
DATA COLLECTION, DATA ANALYSIS, PROGRESS REPORTS, RESEARCH PRESENTATION
TIMELINE:
8 MONTHS FOR DATA COLLECTION
BACKGROUND
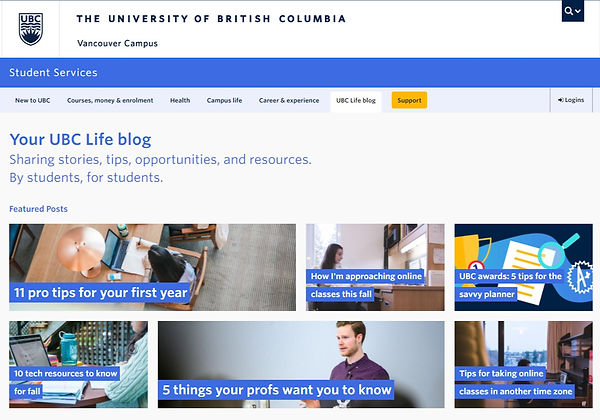
The UBC Life Blog is a student-focused blog managed by UBC Student Communications Services at University of British Columbia (UBC). The blog hosts a variety of student-written content sharing stories, tips, opportunities, and resources for UBC undergraduates. Blog posts topics such as academics, health and wellness, finance, and more.
The Student Communications Twitter account (@UBCstudentlife) serves as a marketing platform for promoting UBC Life blog posts as well as marketing campaigns from campus partners. As an integral part of our blog marketing, it is vital to understand community engagement for this platform.
PROJECT GOAL
The primary objective of the project was to analyze fundamental analytics for the UBC Life blog over the eight-month school year (Sept - April). Identifying top performing blog posts in addition to the general performance of the blog could reveal the needs and interests of the audience, particularly at different times throughout the academic year.
METHODOLOGY
-
Using Google Analytics and Hootsuite, I reported on the top-performing blog posts every two weeks, per term, and then yearly
-
Every two weeks, I presented the data to the Editorial Lead, UX Coordinator, and Content Manager. The data would be used to inform the blog content being developed and published for the following month.
-
Each month, I also shared the analytics with the Editorial team, who would use the insights to plan the student newsletter being delivered the following month.
-
I also used Google Search Console to identify top keywords driving web traffic to the UBC Life blog. Because a large percentage of the traffic to the blog was via Google, it was crucial to understand which keywords were significantly pointing users to top performing blog posts.
ANALYTICS REPORTED
Over the course of eight months, these were the fundamental analytics reported to the team, as well as the questions explored for each.
-
Pageviews and unique pageviews
Which blog posts were garnering the most reads? How do the top-performing blog posts differ from month to month? Were there any marketing campaigns that increased pageviews for a certain blog post? Which blog posts could be beneficial to feature at a specific time next year? -
Average time spent on page
How does the time spent on page differ for an informational blog post versus a listicle, photo essay, or narrative post? -
Source of traffic
How are users landing on blog posts, or the blog in general? If users are primarily coming from Google, is there a necessity for using certain social media channels to drive web traffic? How effective are marketing campaigns performing, such as the student newsletters? -
Device
Are students primarily browsing the blog on a mobile device, tablet, or desktop? How can we improve the user experience depending on how users are consuming the content? -
Search keywords
What keywords are users searching in Google to land on the blog or certain blog posts?
By reporting these basic analytics over 8 months, the Editorial team was able to stay informed on the most relevant content for students, and use the monthly, term, and yearly report to guide their communication and content strategy for the following academic year.I also developed a report comparing analytics from the previous year, showing a general improvement in content and communication strategy for the UBC Life blog.
KEY FINDINGS
-
A majority of the blog traffic happens at the beginning of the school semester in August and September, largely due the “New to UBC” back-to-school student newsletter campaign. First years are also consuming content on what to expect and how to prepare for UBC.
-
The majority of blog visits happen in the first 2 months, with peaks coinciding with the release of the “UBC Life” student newsletters
-
Posts with the highest count of pageviews were less targeted towards the first year experience, instead showcasing a balance between academic advice, health and wellness, and student life
-
For the top performing posts, the main source of traffic was from Google search
RECOMMENDATIONS
-
Resurface top-performing posts relevant to the first year experience in the newsletter around the end of August when readership is its highest
-
Strengthen marketing around these posts for the following year (around the end of July or beginning of August)
-
Continue to create meaningful content for top-performing topics
-
Release specific blog posts at certain time points throughout the academic year, for when they are the most relevant to students (e.g., blog post about exam preparation should be released closer to the exam season)
-
Conduct usability tests to understand how users are navigating the blog, both on desktop and mobile devices, to improve general navigation and user experience of the blog
-
Because Twitter analytics are generating low traffic to the blog posts, consider using an alternative social channel to drive traffic to the blog (e.g., Instagram, Facebook)
REFLECTION
What I found most interesting was monitoring popular posts and capturing how our audience engages with them, as well as looking at the sources of traffic among our different social media platforms. As a writer for the blog, it helped me shape my article pitches and topics I would choose to write about. You can find the total pageviews of my blog posts here (updated August 31, 2020). As the copywriter for Twitter and Instagram, it allowed me to see what kind of copy would elicit a stronger call to action from our followers, and strengthened my editing skills for both platforms.
However, while Google Analytics is a powerful tool for collecting important data, there are certain limitations in regards to analyzing the behavior of users on the blog. Meaningful content that provides actionable items and resources for students should be at a higher priority than generating posts on popular content. Data cannot measure the value or help students receive from reading blog posts written by their peers on common problems.
Nevertheless, these analytics can give us greater insight to what kinds of help and resources our students need. Most importantly, this project allowed me to develop my ability to utilize Google Analytics and Google Search Console to track growth and provide data-based suggestions for improving the marketing communications strategy for the blog.
KEY TAKEAWAYS
-
Take initiative and be open to new projects
-
Collaborate and share interesting information with the team, when it comes to writing, everyone has their strengths and weaknesses
-
Prioritize high quality, relevant content over marketing all types of content
-
Ask others how they interpret the data, be open to new perspectives